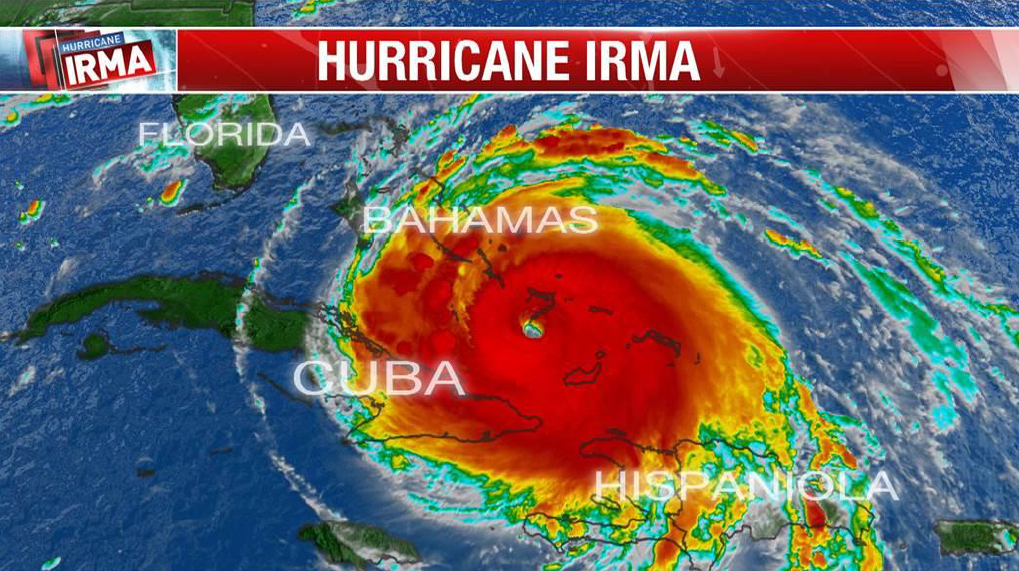
It didn’t even take a week after Hurricane Irma passed through the Lower Keys before my phone started blowing up with calls from bottom feeders looking for Hurricane Irma distress sales. And now, six months later, the first real estate question I am most often asked is, “How has Hurricane Irma affected the real estate market?”
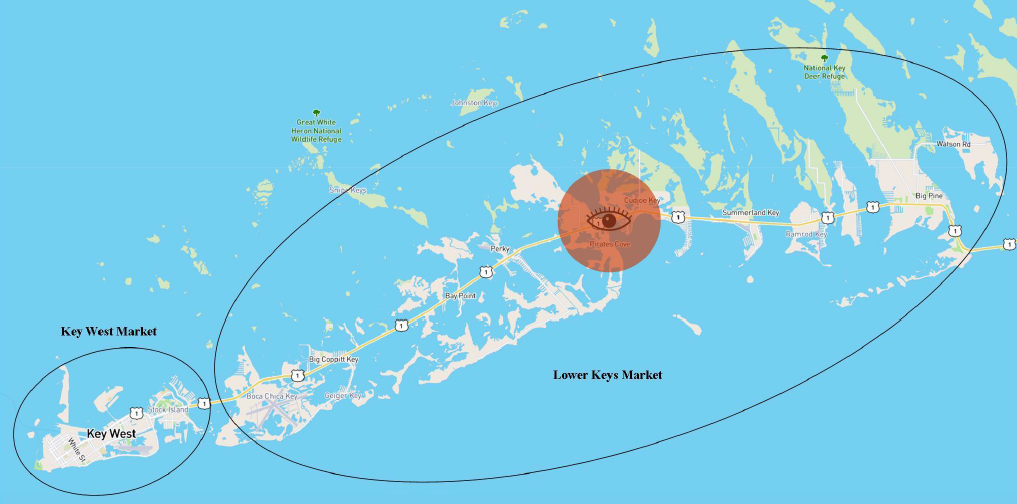
Before answering that question and presenting the statistics, we must first define the markets because the Key West real estate market is vastly different than the Lower Keys real estate market. Because we are all visual beings, let’s refer to the map below; a picture really is worth a thousand words.
Down here in the American Caribbean, we use the Mile Markers (MM) to give directions. US1 (aka Overseas Highway) begins at the Western tip of Key West (MM 0) and runs North (2,369 miles) all the way up to Fort Kent, Maine. At MM 114 is the North boarder of Key Largo where you transition from Monroe County (i.e. The Keys) to Miami-Dade County.
For example, if you were giving directions to someone for a home on Lower Sugarloaf Key, you would say, “Go North on US1 to the flashing light at MM 17 and make a right onto Sugarloaf Blvd.”
I define the Key West geographical market (MM 0-MM 5) as the Island of Key West, Stock Island and Key Haven (aka Raccoon Key).
The Lower Keys market, again my definition (but most of my fellow real estate professionals would agree with me) begins on the Southwest at Boca Chica Key (MM 8) and moving from the Southwest to the Northwest includes Rockland Key (MM 9), Big Coppitt Key (MM 10), Shark Key (MM 11), Saddlebunch Keys/Bay Point (MM 15), Sugarloaf Key (MM 17-19), Cudjoe Key (MM 20-23), Summerland Key (MM 24-25), Ramrod key (MM 27), Little/Middle/Big Torch Keys (MM 28) Big Pine Key (MM 29) and No Name Key (MM 30). Please refer to the map on my homepage.
Key West After Irma
| # Residential Sales 10/01/16 – 03/31/17 |
# Residential Sales 10/01/17 – 03/31/18 |
||
|---|---|---|---|
| Key West Market | 242 | 266 | Up 9.92% |
| Lower Keys Market | 239 | 216 | Down 9.62% |
| Average Sale Price 10/01/16 – 03/31/17 |
Average Sale Price 10/01/17 – 03/31/18 |
||
|---|---|---|---|
| Key West Market | $740k | $796k | Up 7.57% |
| Lower Keys Market | $536k | $514k | Down 4.10% |
So, why was the Key West real estate market up, both in number of sales and average sales price and the lower Keys Marker down in both areas? Again, let’s refer to the map above.
As we can see, the eye of the storm passed over Upper Sugarloaf Key and Cudjoe Key between 8:30am and 9:00am on Sunday morning, Sept 10, 2017. The geographical distance between the eye of the storm and Key West is about 20 miles. That 20 miles, and that Key West was on the Southwest side of the eye made all the difference in the world.
When a hurricane approaches North America from the Atlantic, it spins counterclockwise. The Southwest side of the storm is called the “clean side” and the Northeast side is called the “dirty side”. The winds on the dirty side are stronger, extend much further and cause much greater storm surges.
For example, the winds in Key West (on the clean side of the storm) were Cat III winds and the winds on the dirty side were Cat IV winds. We had no storm surge (i.e. post storm flooding) here in Key West whereas up on Cudjoe & Sugarloaf Keys they had 4-5 feet of storm surge.
In Key West (I was here in my home on Key West for the entire duration of the storm), we sustained little physical & structural damage. There was a fair amount of damage to the Island’s foliage and quite a few large trees down. We were without electricity for a while. Electric service on some parts of the Island was restored in as few as three days while others took eight days. We only had water for 2-4 hours per day right after the storm but full service was restored within a week in most areas.


